Showing posts with label Financial. Show all posts

Friday, March 20, 2026

Fixing a Train/Serve Skew in Sentiment Residuals


Fixing a Train/Serve Skew in Sentiment Residuals

The signal generation process uses a technique called sentiment residualization — essentially, we remove the portion of the FinBERT sentiment score that can be explained by price momentum alone, leaving behind only the genuine sentiment surprise. A stock that has been running up for 20 days will naturally attract positive news coverage, so we want to isolate the sentiment signal that exists above and beyond what the price action would predict.

The problem was subtle. During training, the residual model was fitted on tens of thousands of rows spanning months of history. But at inference time, the same calculation was being refitted fresh each day on whatever small universe of stocks passed the daily filters — typically around 30 stocks. That's a very different statistical population, which meant the sentiment residuals being fed into the composite ranking signal weren't quite the same thing the model had learned from during training. Classic train/serve skew.

The fix was straightforward — serialize the residual model coefficients to disk at the end of each training run and load those fixed coefficients at inference time rather than refitting. Now the definition of sentiment surprise is consistent from training through to live signal generation.

Friday, September 5, 2025

I Need More Financial Quant Data - Techniques On How To Get It

I may have posted earlier about how finding enough data - for free - is extreeeemely difficult.

Even if you can find it, ensuring the integrity of it can cost time money and cycles that make it so much simpler to just let someone else deal with it and just subscribe.  Problem is, I am "subscriptioned out". I can't keep adding layers upon layers of subscriptions, because that money adds up.

So - I work hard to see what data is available out there (i.e. Kaggle). It makes no sense to waste processing cycles and bandwidth if someone has already cultivated that data and is willing to share it.

I also have learned that there are a lot of bots out there that screen-scrape, using tools like Beautiful Soup. And if you are clever enough to use layers of (secure - I can't stress that enough) proxies, and morph your digital fingerprint (i.e. changing up browser headers and such), you can go out there and find data, and save it - and even check the integrity of the data by checking it against a couple or three sources. 

And don't forget rate-limiting and Cloudflare tools - you have to figure out how to evade those as well. It's a chess game, and one that seemingly never ends.

Anyway - I decided I needed quarterly data. My XGBoost model just wasn't computing the way I wanted. I added more interactive features from macro data, and even a "graph score" (see earlier posts). And indeed, the score - the R-squared score - came up - but it didn't get to where I wanted it, and the list of stock picks were not stocks that I would personally make an investment in.

I decided to do two things:

  1. Find superior data source(s) - preferably where I could get more and better quarterly data - for free.
  2. Consolidate the code so that I didn't have to manage and sync code that was fetching on one frequency (annual) vs another.

I underestimated these tasks. Greatly.

I found a Github project that could hit different data sources. It had an OO design - and was probably over-engineered IMHO. But, I got what the author was after - by using a base class and then plugging in different "interface classes", you could maybe switch back and forth between different data sources. 

So I tried it. And, lo and behold it didn't work. At first it did - for annual statements. But after I downloaded about 8k quarterly statements, I was horrified to realize that all of the quarterly statements were clones of the annual statements. Wow what a waste!!!

I checked - and the quarterly data was there indeed. The Github code was flawed. So, I fixed it. And even enhanced it. 

This is the first time I have actually contributed to a community Github project. I am familiar with Git and Github, but if you are not doing this kind of thing on the regular, you have to re-learn topics such as branch development, Pull Requests, Merges, etc. And perhaps one of the most annoying things, is that the upstream owner of the repository may not like or agree with your changes.  

In this particular case,  the repo owner was using property decorators. Well, those work fine if you don't have parameters in your functions, because when you try to reference attributes of a class, it doesn't work if the calls have parameters in them. I had to blow those out. He didn't seem happy about it - but, eventually, he seemed to acknowledge the need to do that.  Another difference of opinion had to do with the fact that he was using a lru_cache decorator on calls. I wasn't up to speed on this, and had to read up on it, and concluded that this was NOT the right situation to use caching, let alone lru caching. It can speed things up TREMENDOUSLY in the right use cases - but if you are batch downloading thousands of statements for thousands of symbols, you are not going to need to consult a cache for every symbol, so a cache like that actually creates overhead - and risk (i.e. running out of resources like memory if you don't have a max size on the cache).

In the end, I have some code that works. I had to do a rebase and update the pull request, and, if he doesn't take these changes the way I wrote them and need them, I guess I can always just create my own repo and go solo on this.  I would rather not, because the repo owner does synch his repository with the pip installer which makes it easy to download and update. 


Thursday, August 28, 2025

Latest Changes to XGBoost Quant Financial Model


Latest Changes:

Added new Macros to my model  - CPI, PPI, VIX (last change I made was to add a beats/meets/misses surprise score a few weeks ago)

I added some interactive features based on these (5 in total). I have learned that these interactives move the model predictability like nothing else - which is why I added more. 

    R-squared score came back up to approaching .3 now with these.

    My correlation is still inverted from 1 yr fwd return - even more so. So I flip the score.

One major change was that I added a "graph_score" which was a nightmare to produce. LLMs can NOT seem to handle this task AT ALL. So I finally had to do it mostly myself, and got something working fairly well - it recognizes good graphs vs bad graphs and downscores bad graph patterns.

I forked the stockdex github project, and am making some changes that I will re-submit back with a git pull. The macrotrends datasource could not handle quarterly data. Once I realized it could be done, I decided to enhance the code to do this so I could run the model and get more quarterly statements alongside the pack of annual statements.  

Once I get the model run with annual+quarterly, I will probably retire this project and move onto more recent and LLM-based stuff.

Tuesday, July 29, 2025

AI / ML - Feature Engineering - Earnings Surprises

I really felt that news would be a great thing to add to the model. But the problem with news, is that news is recent, and this data I am using with XGBoost is historical time-series data. 

If you added news, what would you do - cram the values only into the most recent year?

I think if you go with stuff that is changing and close to real-time, you need to re-think the whole model including the type of model. Maybe news works better with a Transformer model or a LSTM Neural Network model than a predictive regression model.

So - I am running out of new things to add to my model to try and boost the predictability of it (increase the R-squared).

Then I came up with the idea of adding earnings hits, misses and meets. A quick consult with an LLM suggested using an earnings_surprise score, so that not only do we get the misses/meets/beats counts but also we capture the magnitude.  A great idea.

I implemented this, and lo and behold, the earnings_surprise score moves the needle. Substantially and consistently.

The best thing about this, is that the earnings_surprise score is symbol-specific, and so it is not some macro feature I have to figure out how to interact with the symbol data. 

Saturday, July 5, 2025

AI / ML - Here is Why You Backtest

My model was working nicely. 

It scored stocks on a number of fronts (pillars).

It used Profitability. It used Solvency. It used Liquidity. It used Efficiency.

These are the "four horseman" of stock evaluation.

I added some of my own twists to the "grading formula", in the form of macro variables (consumer sentiment, business confidence, et al).  I also had some trend analysis, rewarding trends up and penalizing trends down. I rewarded (and penalized) profitability, cash flow, etc. I had scaling done correctly, too in order to ensure a "fair playing field", and also some sector normalization as well.

When I ran the model, using XGBoost to predict 1-year forward return, the stocks at the top of the report looked great when I spot-checked them against various sites that also grade out stocks. I felt good. The r-squared I was getting from XGBoost and a SHAP-pruned feature run was at academic levels (as high as .46 at one point).

As part of some final QA, I ran the resultant code through AI engines which praised the thoroughness, and slapped me on the back reassuring me that my model was on a par with, if not superior to, many academic models.

Then - someone asked me if this model has this been back-tested. 
And the answer was no.  I had not back-tested it up to that point. I didn't think I was ready for back-testing. 

Maybe back-testing is an iterative "continual improvement" process that should be done much earlier in the process, to ensure you don't go down the wrong road.  But I didn't do that.

So, I ran a back-test. And to my horror, the model was completely "upside down" in terms of stocks that would predict forward return.  The AI engines suggested I simply "flip the sign" on my score and invert them. But that didn't feel right. It felt like I was trying to force a score.  

So - the first thing we did, was evaluate the scoring. We looked at correlation between individual scoring pillars and forward return. Negative.

We then looked at correlation in more detail.

First, we calculated Pearson (row-level) and Spearman (rank-level). correlations.

They were negative.

Then, we calculated Average Fwd Return by Score Decile. Sure enough, there was a trend, but completely backwards from what one would expect. 

Quality stocks with scores of 9,8,7,6,5 had negative values that improved as the decile dropped, while the shaky stocks (0,1,2,3,4) had graduated positive values.

The interesting analysis, was a dump of the correlations of each individual pillar to fwd return. The strongest were Profitability and Valuation, followed by MacroBehavior (macroeconomic features) but these were not strong. And the correlations were slightly negative, a couple slightly above zero positive.

But - one was VERY interesting. A log1p correlation between the "final composite score" to forward return that was noticeable if not sizable - but negative.

We experimented with commenting out the penalties, so we could focus on "true metrics" (a flag was engineered in to turn these off which made it easy to test). Re-ran the model, STILL the correlations with forward return were negative.

Then - we decided to remove individual pillars. Didn't change a thing. STILL the correlations with forward return were negative.

Finally, after the AI ensured me - after reviewing the code - that there were no scoring errors, the only thing left to try, aside of shelving the model for lack of success in predicting forward return, was to in fact put a negative sign on the score to invert it and "flip the score".

I did this. And, while the companies that bubbled to the top were shaky on their fundamentals, I did see cases where Analyst Ratings on these stocks were above (and in some cases way above) the current stock price.  

So here is the evidence that we have a model that IS predicting forward return, in a real way.

So - in conclusion. Quality does NOT necessarily equate to forward return.

What does??? Well, nothing in those pillars individually. But - when you combined all of these metrics/features into a big pot, and send them to a sophisticated regression modeler, it does find a magical combination that can predict a relationship with forward return that is linear, and depending on whether you flip that line one way or another, you can theoretically gain - or lose - a return on your money.

Now, if we had put money into those "great stocks" at the top of that prior list, and then had to watch as we lost money, it would have been puzzling and frustrating. But - do we have the courage to put money into these less-than-stellar fundamental stocks to see if this model is right, and that we WILL get a positive forward return? 

I guess it takes some experimentation. Either a simulator, OR, put $X into the top ten and another $X into the bottom ten and see how the perform. Which is what I might be doing shortly. 


Wednesday, July 2, 2025

AI / ML - Altman-Z Score

I saw a website that was showing an Altman-Z score for companies in their Solvency section.

Not fully aware of this calculation, I decided to jump in and add it to my model.

I quickly backed it out.

Why?

Altman-Z uses different calculations based on the industry a company is in. 

Manufacturers use one calculation, other companies use another, and banks and finance companies don't calculate it at all. 

So imagine calculating this and feeding it into XGBoost / SHAP to predict price or return on a security. 

First of all, because you have so many NaN values (nonexistents), you have a Missingness issue. Then, the values differ due to different calculation methods. If you don't cap the score, you can get outliers that wreak havoc.

So in the end, it's fine to calculate it, but if you calculate it, don't model it as a predictive feature. 

Just calculate it and "tack it on" (staple it) to any sector-specific scores you are generating for purposes of stuff like rank within sector. 

Friday, June 13, 2025

AI/ML Feature Engineering - Adding Feature-Based Features

I added some new features (metrics) to my model. The Quarterly model.

To recap, I have downloaded quarterly statements for stock symbols, and I use these to calculate an absolute slew of metrics and ratios. Then I feed them into the XGBoost regression model, to figure out whether they can predict a forward return of stock price.

I added some macro economic indicators, because I felt that those might impact the quarterly price of a stock (short term) more than the pure fundamentals of the stock. 

The fundamentals are used in an annual model - a separate model - and in that model, the model is not distracted or interrupted with "events" or macroeconomics that get in the way of understanding the true health of a company based on fundamentals over a years-long period of time.

So - what did I add to the quarterly model?

  • Consumer Sentiment
  • Business Confidence
  • Inflation Expectations
  • Treasury Data (1,3,10 year)
  • Unemployment 

And wow - did these variables kick in. At one point, I had the model up to .16. 

Unemployment did nothing, actually. And I wound up removing it as a noise factor. I also realized I had the fiscal quarter included, and removed that too since it, like sector and other descriptive variables, should not be in the model.

But - as I was about to put a wrap on it, I decided to do one more "push" to improve the R-squared value, and started fiddling around. I got cute, adding derived features. One of the things I did, was to add lag features for business confidence, consumer sentiment, inflation expectations. Interestingly, two of these shot to the top of influential metrics.

Feature Importance List Sorted by Importance (return price influence).
feature                                                 weight
business_confidence_lag1                0.059845
inflation_lag1                                       0.054764

But, others were a bust, with .00000 values.

I tried removing the original metrics and JUST keeping the lags - didn't really help.

Another thing worth noting, is that I added SHAP values - a topic I will get into more depth about shortly, perhaps in a subsequent post. SHAP (SHapley Additive exPlanations) is a method used to explain the output of machine learning models by assigning each feature an importance value for a specific prediction, so that models - like so many - are not completely "black box".

But one thing I noticed when I added the SHAP feature list, is that it does NOT match / line up with the feature importances that the XGBoost model espouses. 

So I definitely need to look into this.

Wednesday, June 11, 2025

AI/ML - Feature Engineering

Originally, when I first started this project to learn AI, I set it up thus:

Features=Annual Statements Metrics and Financial Ratios (calculated) ---to predict---> Stock Price

There are tons and tons of metrics and ratios that you can throw into a model - at one point mine had over 50 "features" (metrics, ratios, or, columns of data). 

Quickly, you get into Feature Engineering. 

You see, certain metrics are "circular" and co-dependent. You can not use price-derived metrics to try and predict price. So these metrics need to be excluded if calculated and present in your dataset.

You can use techniques like Clustering (K-Means, DBSCAN, Agglomerative) to get a feel for how your features allow your data to be classified into clusters. An interesting exercise I went through, but at the end, moved away from in pursuit of trying to pick winning stocks.

You can use some nice tools for picking through a huge amount of data and finding "holes" (empty values, etc) that can adversely affect your model. 

From a column (feature) perspective, you can: 

  • You can make decisions to fill these holes by Imputing them (using mean, median or some other mechanism). 
  • Or, you can drop these holes.

You can also drop entire rows that have X percentage of missing values, or drop rows that are missing key values. Figuring all of this out takes time. It is part of the Data Engineering.

Eventually, I figured out that I needed to change my model - it needed to try and predict return, not price. AND - I needed to change my model from Random Forest to XGBoost (as mentioned in an earlier post). 

So now, we will be doing this...

Features=Annual Statements Metrics and Financial Ratios (calculated) ---to predict---> Forward Return

Well, guess what? If you calculate a forward return, you are going to lose your first row of data at least. Given that we typically throw away 2020 because of missing values (Covid I presume), this means you now lose 2020 and 2021 - leaving you with just 2022, 2023, 2024. Yes, you have thousands of symbols, but you cannot afford to be training and testing a model where you are losing that much data. But - that is the way it has to be...most financial models are seeking return, not a price. Enlightening. Makes sense.

 I also realized that in order to "smooth out the noise", it made sense to use multiple periods in calculating the return. This causes MORE data to be lost. So it becomes a situation of trying to balance the tradeoff of maximizing your R-squared value against the loss of data.

I added some additional metrics (features): 

  • qoq growth (eps, revenue, free cash flow) 
  • momentum  

 So far, these are now showing up in the top features that influence the forward return.

But the R-squared for the Quarterly model is .09 - which is extremely low and not very valuable. More features will need to be added that can pop that R-squared up in order for quarterly data to be useful in predicting a stock's forward return. 

Friday, May 23, 2025

AI / ML - Random Forest, Data Wrestling and Z-Scores

I was running my AI scoring algorithm, which takes as inputs a bunch of calculated metrics and ratios (features - X axis), and feeds those into a Decision Tree algorithm (Random Forest), against a price prediction (Y axis), which then prints out a report that shows how well the algorithm performed in general (R-squared), and a list of features sorted by their influence on the Y variable (price). 

There are numerous algorithms that can do this - the simplest being a Linear Regression model.  Decision Trees offer a faster and more efficient - and perhaps more accurate - alternative to linear regression, provided that the tree is pruned and managed correctly and that the tree doesn't get lopsided or imbalanced.

But I ran into problems, especially when checking the results and data carefully. And most of the issues, were related to the data itself.

Data Alignment
I noticed that the predictive z-scores for my features didn't "line up" when I printed them twice. Turns out, this was a data alignment issue. When you are using dataframes, and making copies of these dataframes and merging them, you need to be very very careful or a column can get shifted.

This alignment issue was affecting my model because the metric that WAS a profitability metric, was now being assigned to a solvency metric. Now that I have this fixed, things look much more sensible. But making sure your dataframes are aligned, is a hard-learned lesson.

Outliers
Other issues I ran into today had to do with the fact that when I printed a report out (a weighted scoring report), certain values were far and away better than others. I didn't understand this, and discussed it with the AI I am using as a consultant, who suggested I print out z-scores.

Well, if we look below, we have an evToEBITDA metric of 10.392 (insane value) on 2023 Paramount reporting data.

=== Z-scores for PARA on 2023-12-31 ===
Z-scores for PARA on 2023-12-31 in pillar 'Profitability':
  grossProfitMargin: -0.263
  operatingProfitMargin: 0.038
  netProfitMargin: 0.029
  returnOnAssets: -0.033
  returnOnEquity: -0.006
  returnOnCapitalEmployed: -0.089
  returnOnTangibleAssets: 0.004
  earningsYield: 0.008
  freeCashFlowYield: 0.000
  nopat_to_totalAssets: -0.170
  operatingReturnOnAssets: -0.215
  returnOnInvestedCapital: -0.031
  ebitda_to_totalAssets: -0.384
  operatingCashFlowToSales: 0.036
  evToSales: -0.044
  evToOperatingCashFlow: 0.054
  evToEBITDA: 10.392
  evToFreeCashFlow: 0.039
 
I audited the metrics and statements, and indeed this is correct - based on what Yahoo was returning to me on the income statement for that year (Normalized EBITDA). The unnormalized EBITDA was better, but in most cases, analysts use the Normalized value. You can't do one-offs in your code for things like this, so what do you do?

I couldn't drop the row, because I was already dropping so many 2020 rows of bad data (due to Covid I suspect). I drop rows that are missing >35% of metrics. When you get a row that has all of the values you need, you tend to want to use it. I don't have code that drops rows that don't have specific dealbreaker metrics - maybe I should, but there are so many metrics that generally I figure I can score and rank even if I am missing one here or there, even a fairly well-known or important one. 

So - what do you do?

Winsorization. In other words, capping. It might make sense to invest the effort in Winsorizing all of the metrics and ratios. But for now, I am only doing it on these EBITDA ones.

Thursday, June 20, 2024

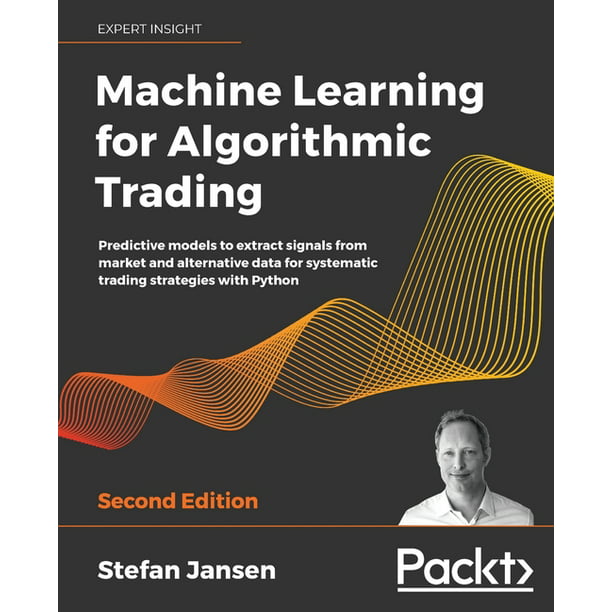
New AI Book Arrived - Machine Learning for Algorithmic Trading

This thing is like 900 pages long.

You want to take a deep breath and make sure you're committed before you even open it.

I did check the Table of Contents and scrolled quickly through, and I see it's definitely a hands-on applied technology book using the Python programming language.

I will be blogging more about it when I get going.


Removing Two Stale Macro Features

  Removing Two Stale Macro Features The model was trained on 11 features, two of which were macroeconomic sentiment indicators sourced from...