Showing posts with label Zabbix. Show all posts

Friday, April 4, 2025

SLAs using Zabbix in a VMware Environment

 Zabbix 7 introduced some better support for SLAs. It also had better support for VMware.

VMware, of course now owned by Broadcom, has prioritized their Aria Operations (VROPS) monitoring suite over any of the alternative monitoring solutions (of which there is no shortage). Usually open source solutions have a limited life cycle as developers leave the project and move on to the next zen thing. Zabbix is still widely popular after many years. They got it mostly right the first time, and it absolutely excels at monitoring Linux. 

To monitor VMware, it relies on VMware templates - and it used to present "objects" like datastores, as hosts. In version 7, it no longer does this, and instead tie the datastores as attributes of the true hosts - hypervisors, virtual machines, etc. This makes it a bit harder to monitor a datastore in an of itself - getting free space, used space, etc. if you want to do that.  But - in version 7 there are now all kinds of hardware sensors and stuff that were not available in version 5. There are more metrics (items), more triggers that fire out of the box, etc.

One big adjustment in v7 is the support for SLAs. I decided to give it a shot.

The documentation only deals with a 3 node cluster. Such as a back-end cluster. That is not what I wanted.

What I wanted, was to monitor a cluster of hypervisors in each of multiple datacenters.

To do this, I started with SLAs:

  • Rollup SLA - Quarterly
  • Rollup SLA - Weekly
  • Rollup SLA - Daily

 Then I created a Service

  • Rollup - Compute Platform

Underneath this, I created a Service for each data center. I used two tags on each one of these, one for datacenter and the other for platform (to future-proof in the even we use multiple platforms in a datacenter). Using an example of two datacenters, it looked like this.

  • Datacenter Alpha Compute
    • datacenter=alpha
    • platform=accelerated
  • Datacenter Beta Compute
    • datacenter=beta
    • platform=accelerated 

These services have really nothing defined in them except the tags, and I assigned a weight of 1 to each of them (equal weight - we assume all datacenters are equally important).

Underneath these datacenter services, we defined some sub-services.

  • Datacenter Alpha Compute
    • Health
      • Yellow
      • Red
    • Memory Usage
    • CPU
      • CPU Utilization
      • CPU Usage
      • CPU Ready
    • Datastore
      • Read Latency
      • Write Latency
      • Multipath Links
    • Restart 

We went into the trigger prototypes, and made sure that the datacenter, cluster and platform were set as tags so that all problems would have these tags coming in, necessary for the Problem Tag filter.  We also had to add some additional tags to differentiate between severity warning and critical (we used level=warning for warnings, and level=high for anything higher than a warning). 

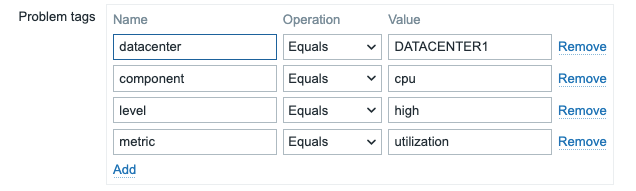
On the problem tags filter, we wanted to catch only problems for our datacenters and this specific platform, so we used those two filters on every tag. In this example below, we have a cpu utilization service - a sub-service of CPU, which in turn is a sub-service of a datacenter.

This worked fairly well, until we started doing some creative things.

First, we found that all of the warnings were impacting the SLAs. What we were attempting to do, was to put in some creative rules, such as:

  • If 3 hypervisors or more in a cluster have a health = yellow, dock the SLA
  • Use a weight of 9 on a health red, and a weight 3 on as situation where 3 hypervisors in a cluster have a health of yellow. 

THIS DID NOT WORK. Why? Because unless every single hypervisor was a sub-service, there was no way to make it work because the rules all applied to child services. We couldn't have all of the hypervisors be a sub-service - too difficult to maintain, too many of them, and we were using Discovery which meant that they could appear or disappear at any time. We needed to do SLAs at the cluster level or the datacenter level, not individual servers (even though indeed we monitor individual servers, but they are defined through discovery).

So, we had to remove all warnings from the SLAs

    • They were affecting the SLA too drastically (many hypervisors hit health=yellow for a while and then recover). We had to revert to just the red ones and assume that a health=red affects availability (it doesn't truly affect availability necessarily, but it does in certain cases).

    • We could not make the rules work without adding every single hypervisor in every single datacenter as a sub-service which simply wasn't feasible.

The problem we now face, is that the way the SLAs roll up, the rollup SLA value is essentially the lowest of the SLA values underneath it.

  • Platform SLA (weight 0) = 79.7 - huh?
    • Datacenter A (weight 1) = 79.7
    • Datacenter B (weight 1) = 99.2
    • Datacenter C (weight 1) = 100

The platform SLA should be an average, I think, of the 3 datacenters if they are all equal-weighted. But that is not what we are observing.

The good news though, is that if Datacenter A has a problem with health=red, the length of time that problem exists seems to be counting against the SLA properly. And this is a good thing and a decent tactic for examining an SLA.

The next thing we plan to implement, is a separation between two types of SLAs:

  • Availability (maybe we rename this health)
  • Performance
So a degradation in cpu ready, for example, would impact the performance SLA, but not the availability SLA. Similar for read/write latency on a datastore. 

I think in a clustered hypervisor environment, it is much more about performance than availability. The availability might consider the network, the ability to access storage, and whether the hypervisor is up or down. The problem is that we are monitoring individual hypervisors, and not the VMware clusters themselves, which are no longer presented as distinct monitor-able objects in Zabbix 7.
 
But I think for next steps, we will concentrate more on resource usage, congestion, and performance than availability.

Monday, November 18, 2024

Cisco UCS M5 Server Monitoring with Zabbix

I got a request from my manager recently, about using Zabbix to monitor Cisco servers.  

Specifically, someone had asked about whether it was possible to monitor the CRC errors on an adaptor.

Right now, the monitoring we are doing is coming from the operating systems and not at the hardware level. But we do use Zabbix to montor vCenter resources (hypervisors), using VMware templates, and we use Zabbix to "target monitor" certain virtual machines at the Linux OS level (Linux template) and at Layer 7 (app-specific templates).

Up to this point, our Zabbix monitoring has been, essentially, "load and forget" where we load the template, point Zabbix to a media webhook (i.e. Slack) and just monitor what comes in. We haven't really even done much extension of the templates, using everything "out of the box". Recently, we did add some new triggers on VMware monitoring, for CPU and Memory usage thresholds. We were considering adding some for CPU Ready as well.

But...this ask was to monitor Cisco servers, with our Zabbix monitoring system.

The first thing I did, was to check and see what templates for Cisco came "out of the box". I found two:

  1. Cisco UCS by SNMP
  2. Cisco UCS Manager by SNMP

I - incorrectly - assumed that #2, the Cisco UCS Manager by SNMP, was a template to interface with a Cisco UCS Manager. I learned a bit later, that it is actually a template to let Zabbix "be" or "emulate" a Cisco UCS Manager (as an alternative or replacement). 

First, I loaded the Cisco UCS by SNMP template. The template worked fine from what I could tell, but it didn't have any "network" related items (i.e. network adaptors).

As mentioned, after reading that Cisco UCS Manager was an extension or superset of Cisco UCS by SNMP, I went ahead and loaded that template on some selected hosts. We were pleased to start getting data flowing in from those hosts, and this time the items included in the template were adaptor metrics, but very basic metrics such as these shown below.

Adaptor/Ethernet metrics in Cisco UCS Manager Template

This was great. But we needed some esoteric statistics, such as crc errors on an adaptor. How do we find these? Are they available?

Well, it turns out that they indeed are available...in a MIB called:CISCO-UNIFIED-COMPUTING-ADAPTOR-MIB

Unfortunately, this MIB is not included in the CISCO-UCS-Manager template. So what to do now? Well, there are a couple of strategies...

  1. Add a new Discovery Rule to the (cloned) Cisco UCS Manager template. 
  2.  Create a new template for the adaptor mib using a tool called mib2zabbix.
I tried to do #1 first, but had issues because the discover rule needed an LLD Macro and I wasn't sure how, syntactically, to create the Discovery Rule properly. My attempts at doing so, failed to produce any results when I tested the rule.
 
I went to pursue #2, which led me down an interesting road. First, the mib2zabbix tool requires the net-snmp package to be installed. And on CentOS, this package alone will not work - you also have to install net-snmp-util package to get the utilities like snmptranslate that you need.

The first time I ran mib2zabbix, it produced a template that I "knew" was not correct. I didn't see any of the crc objects in the template at all.  I did some additional research, and found that for mib2zabbix to work correctly, there has to be a correct "mib search path". 

To create the search path, you create a ".snmp" folder in your home directory, and in that directory, you create an snmp.conf file. This file looked as follows for me to be able to run snmptranslate and mib2zabbix "properly".
 
mibdirs +/usr/share/snmp/mibs/cisco/v2
mibdirs +/usr/share/snmp/mibs/cisco/ucs-C-Series-mibs
mibdirs +/usr/share/snmp/mibs/cisco/ucs-mibs


Thursday, November 7, 2024

Zabbix to BigPanda Webhook Integration

Background
BigPanda has made its way into the organization. I wasn't sure at first why, given that there's no shortage of Network Monitoring OSS / EMS systems in play. 

Many vendors use their own EMS. VMware for example, uses VROPS (vRealize Operations Suite - now known as Aria Operations). So there is and has been a use case for consolidating this information from these disparate monitoring systems into a "Northbound" system. 

So that's what BigPanda is, I guess. It was pitched as a Northbound system. It does not seem to be very mature, and it is simpler to use than most of them (based on limited inspection and reading). But the business case pitch is that it has an Artificial Intelligence rules engine that provides superior correlation, and if this is true, it could certainly make it a northbound system worthy of consideration.

So - that is why we stepped in to integrate Zabbix with BigPanda. We already have VROPS as our "authoritative" monitoring system for all things VMWare. Our team, which does use this VROPS, does not own and manage that platform (another group does). I believe they use it to monitor the vCenters, the hypervisors, and datastores.  I don't think they're using it to monitor tenant workloads (virtual machines running on the hypervisors).

Our Zabbix platform, which we manage ourselves, is a "second layer of monitoring" behind VROPS. It manages only the VMWare Hypervisors along with some targeted specific virtual machines we run (load balancers, cloud management platform VMs, et al).  The BigPanda team wanted to showcase the ability to correlate information from Zabbix and VROPS, so we volunteered to integrate the two systems. 

Note: It is critical when integrating, that these integration steps be done in precisely this order!!!

Integration Steps

Setting up the Media Type

First, you need to "create" a Media Type - and this means Importing one, not creating one. There are two buttons when you click Media Type, "Create" and "Import". Because the Media Type has already been crafted, we will use "Import". The BigPanda Media Type, which is classified as a Webhook media type, is available for download, and you can find this (json) file at the following link: https://docs.bigpanda.io/docs/zabbix

When you import this webhook media type,  you have the option to "Update Existing" or "Create New". The first time, of course, requires "Create New" but any subsequent updates to the webhook would utilize the "Update Existing" button. 

After the media type has been created, everything will auto-populate. The Media Type tab will have a name (BigPanda in this case), a Type (Webhook), and a set of parameters. Most of these can be left alone, but four of them will need to be changed to literal values of macros (literal values for initial testing is recommended): BP_app_key, BP_endpoint, BP_token - and the zabbix url (which is at the bottom and out of view in the screenshot example below).

Big Panda Media Type Screenshot Example


Setting Up the User Group

Next, you will create a User Group. The main reason for creating a (new) Big Panda user group, is that you can restrict the access of the Hosts that Big Panda has access to. If you wanted to allow Big Panda to have free roam access to all monitored hosts, then you probably could use one of the other host groups available. We wanted Big Panda to only receive alerts for specific hosts (hypervisors, test VMs, etc) so this was the justification for creating a new and separate Big Panda group. In the Host Permissions, we give this new user group Read access to these host groups.

Below is an example of what this group looks like.

Now, one thing worth looking at in this example, is the fact that the newly created User Group has Debug disabled. But there is a separate Debug Enabled group which does have Debug enabled, and any groups that we want to be debugged, can simply be slipped into this group.  There will be more on debugging later. Another thing worth mentioning, is that we did NOT enable FrontEnd access for this user group. This is an integration outbound, and we don't expect a Big Panda user / group to be logging into the UI.

Setting Up the User

Next, we create the User. Users need to have a Media Type, and are placed in User Groups which is why the Media Type and User Groups were created BEFORE the user.  Below, is an example of how the user is defined:

Notice that the user is mapped into the bigpandaservice User Group that we created in the previous step, which is why the User Group was pre-created in a previous step.

Now, after we establish the user fields, it is critically important to attach the User to the Media Type. Without this mapping, the alerts from Zabbix WILL NOT SEND!!!


After this Update button is hit, it is wise to verify and double-verify that this Media Type sticks - in our case, it did not and we had to remove the user and re-create it for some reason.

The final step in configuration is to create a Trigger Action on the Media Type. This is how that looks:


Next, you can click on Media Type, and select the "Test" button next to BigPanda. If you don't fill in the umpteen fields, and leave them as macros, with just the 4 fields we configured in the Media Type (endpoint, api key, token and zabbix url), the Test button "should" produce a 201 result, but you may get a json parse error because no actual data was sent. This is okay.

If the 201 exists, the Big Panda should receive the test alert. But this does not mean that the trigger is firing!!! The step to be taken after the Media Type "Test" button, is to generate an alert condition on the hosts that the Big Panda host group has access to, and make sure that Big Panda receives it!

Debugging & Troubleshooting

Troubleshooting requires making sure that all of these configuration steps were taken properly. This Webhook integration is all about mappings - users to user groups, users to media types, trigger definitions, host groups that are correct, etc.

When it comes to debugging, the debugging for a Webhook occurs within the Webhook!!!

The BigPanda Webhook, meaning the json file you imported, if you click on the Webhook you can see this json! In the screenshot below, notice the field called "script"...


If you were to click the "pencil" icon to the right, it will open up the entire webhook source code, which in this case is written in JavaScript.  

Now, you will notice that the BigPanda Webhook is sending messages to the Zabbix log at Level 4. The problem is, most people shouldn't be using Level 4 in their Zabbix logging (in zabbix_server.cfg file). It is too voluminous and makes debugging impossible if you are watching or tailing the log looking for webhook-specific messages. 

What I did, for testing and debugging, was to use a level that allows me to see the Webhook information without having to comb through a mountain of Zabbix debug information that you would normally see at Level 4 (Debug level). You will see in the screenshot below, that I commented out the "level 4" and replaced it with "level 2" - temporarily of course, until I could make sure that the Webhook was working properly. This example below, of course is just that: an example of how you can more simply debug the webhook. There are more lines in this code that I made these kinds of changes to, but the screenshot gives you an example of how it's done.

So hopefully that helps anyone wanting to get the BigPanda Webhook working in Zabbix, or for that matter, these steps should be helpful for any Webhook integration (i.e. Slack, Discord, et al).

Thursday, November 10, 2022

Zabbix log file parsing - IPtables packet drops

I recently had to create some iptables rules for a clustered system, restricting traffic from RabbitMQ, Percona and other services to just the nodes participating in the cluster.  The details of this could be a blog post in and of itself.

I set up logging on my IPTables drops, which was initially for debugging. I had planned on removing those logs. But, once I got all the rules working perfectly, the amount of logging drops down to almost zero. The only thing that gets logged at that point, are things you would want to know about. So I decided to leave the logging for dropped packets in play (if you do this, make sure your logs wrap and manage your disk space!).

When you put up a firewall that governs not only inbound traffic but also outbound traffic, you learn a LOT about what your system is receiving and sending, and it is always interesting to see traffic being dropped. I had to continually investigate traffic that was being dropped (especially outbound), and whitelist those services once I discovered what they were. NTP, DNS, all the normal things, but also some services that don't come to mind easily.

Logging onto systems to see what traffic is being dropped is a pain. You might be interested and do it initially, but eventually you will get tired of having to follow an operational routine.

I decided to do something more proactive. Send dropped packets to Zabbix.

To do this, here are the steps:

1. Add 2 new items to the hosts that employed the IPTables rules.

  • Iptables Dropped Packet Inbound
  • Iptables Dropped Packet Outbound

2.  Configure your items 

Configure your rules properly, as shown below (example is Inbound drops)

Zabbix Log File Item


First, and this is important, note the Type. It is Zabbix agent (active), not the default "Zabbix agent". This is because a log file check requires an active agent, and will not work if Zabbix is configured as a passive agent. There are plenty of documents and blogs on the web that discuss the difference between Active and Passive.

A passive agent configuration means Zabbix will open the TCP connection and fetch back the measurements it wants on port 10050. An active agent, means that the monitored node will take the responsibility of initiating the connection to the Zabbix server, on port 10051. So passive is "over and back" (server to target and back to server), while active is "over" (target to server). There are firewall repercussions for sure, as the traffic flow is different source to destination, and the two approaches use different ports.

Note that the 2nd parameter on the key, is the search string in the log. This can be a regular expression if you want to grab only a portion of the full line. If you use a regular expression, you can put it in tickmarks. I imagine a lot of people don't get this 2nd parameter correct which leads to troubleshooting. And, I think many people don't realize that you don't need to be putting in carets and such, to get what you need. For instance, I initially had "^.*IPtables Input Dropped.*$" in this field, when I realized later I only needed "IPtables Input Dropped". You only need to be slicing and dicing with complex regular expressions, if you want the output to be trimmed up.

The third parameter to be concerned with, is the Type of Information. This is often overlooked. It needs to be Log. Overlook this, which is easy to do, and it won't work!

I went with an update interval of 1m (1 minute), and a history storage period of 30d (thirty days). This was to be conservative on space lest we get a ton of log activity.

Also note that the item is Disabled (Enabled unchecked). This is because - we can not actually turn this on yet! We need to configure the agent for Active! THEN, this item can be verified and tested.

3. Next, you need to configure your agent for Active.

I wasn't sure initially, if a Zabbix agent had to be one or the other (Active or Passive mutual exclusive). I had my agent initially set to Passive. In Passive Mode, Zabbix reaches out on an interval, and gathers up measurements. Passive is the default when you install a Zabbix agent. 

To configure your agent to be Active, the only thing I needed to do, was to put a Server=x.x.x.x address in the Active section of the zabbix_agentd.conf file in /etc/zabbix directory of the monitored VM.

Don't forget to restart the zabbix-agent service!

4. Next, you need to make sure the firewalls on both sides are allowing Zabbix

On the monitored node (running Zabbix Agent), I was running iptables - not FirewallD. So I had to add an iptables rules for port 10051. 

iptables -A OUTPUT -p tcp -d ${ZABBIX} -m tcp --dport 10051 -j ACCEPT

On the Zabbix server itself, which happens to be running FirewallD, we simply added port 10051 to the /etc/firewalld/services/zabbix.xml file:

 <?xml version="1.0" encoding="utf-8"?>
<service>
  <short>Zabbix</short>
  <description>Allow services for Zabbix server and agent</description>
  <port protocol="tcp" port="10050"/>
  <port protocol="tcp" port="10051"/>
</service>

But you are not done when you add this! Make sure you restart the firewall, which can be done by restarting the service, or, if you don't want a gap in coverage, you can "reload" the rules on a running firewall with:

# firewall-cmd --reload

which generates "success" if the firewall restarts properly with the newly added modifications.

5. Now it is time to go back and enable your items!

Go back to the Zabbix GUI, select Configuration-->Hosts, and choose the host(s) that you added your 2 new items for (IPtables-Input-Dropped, IPtables-Output-Dropped). Select Items on each one of these hosts, choose the item and click the Enabled checkbox.

6. Check for Data

Make sure you wait a bit, because the interval time we set is 1 minute. 

After a reasonable length of time (suggested 5 minutes), go into the Zabbix GUI and select Monitoring-->Latest Data. In the hosts field, put one of the hosts into the field to filter the items for that particular host.

Find the two items, which are probably at the last page (the end), in a section called "other", since manually added Items tend to be grouped in the "other" category. 

On the right hand side, you should see "History". When you click History, your log file entries show up in the GUI!

AI / ML - Feature Engineering - Interaction Features

I added some new macro features to my model - credit card debt, credit card delinquency, and unemployment data. Some of these were VERY infl...