Friday, June 6, 2025

AI Bot Assistants - How they Behave, How they Compare

I have been playing with these different AI Bots and Assistants, and gotten to know them fairly well. 

Originally I used ChatGPT. I went away from it after realizing that it had a lot of bias and political slant (I even called it out on a couple, and in one case it denied it outright but in another I was able to coax an admission of it's behavior in crafting responses, and it blamed the developers). 

I then went to Perplexity which I loved. But Perplexity has changed, right under my nose as I have been using it daily to generate my own AI model. When I started, Perplexity was 'friendly'. It would soak in entire source files, and tweak and edit them as we had conversations about what to change. 

But then, this behavior suddenly changed. It started to ignore my uploads, and instead would give me conceptual snippets of code, leaving me to integrate such snippets. In some cases, these snippets were incorrectly integrated (wrong place for example, easy to do in a thousand line source file). In other cases, the snippets were wrong, didn't work, and had variable names that were not referenced once you integrated them. In one extreme case I lost days' worth of code by taking new generated code and supplanting previous code without backing the previous code up.

Look. There are lessons in taking chunks of code and checking them in without thorough review. But we all know how it goes. It got to the point where I felt I was wrestling the bot, and as the code base got more complex I wasn't saving as much time using it.

So I started just going with the conceptual snippet approach. Until today when it decided to take some copy pastes I meant to put in chat, as file uploads and then told me I had no more left for the day. 

I went back to ChatGPT and had a great day with it. It has improved. 

I went back to Perplexity and told it that it may have lost out. Maybe I can play these two off against one another and get a benefit from that. See? I am an AI myself. Reinforcement Learning.

Tuesday, June 3, 2025

AI / ML - Bagging vs Boosting - A Bake-Off Between Random Forest with XGBoost

I had not heard of XGBoost until I encountered someone else who was also doing some Fintech AI as a side project to learn Artificial Intelligence. Having heard about it, I was brought up to speed on the fact that there are two Ensemble models: Bagging and Boosting. Random Forest is a prevailing Bagging algorithm, while XGBoost is a Boosting algorithm.

These models work well with structured (tabular) data like financial data.  XGBoost was supposed to be the "better" algorithm, so I decided to do a quick test before I came into the office this morning.

I cloned the code,and took the function that runs Random Forest, and created a function that runs XGBoost. Then I ran them both. I ran Random Forest first, then XGBoost. The R-squared value was .5588 for Random Forest, and .5502 for XGBoost.

So on this test, Random Forest won - but not by a huge margin. 

Both of these models can be tuned. To tune either of these, one would rely on what is known as a Grid Search that scouts out different possibilities of parameters as samples and reports back.


So...I will tune the hyperparameters of both of these and re-test. 

Followup:

After tuning Random Forest and re-running, this is what we got.

Best Random Forest parameters found: {'max_depth': None, 'max_features': 'sqrt', 'min_samples_leaf': 1, 'min_samples_split': 2, 'n_estimators': 500}
Best RF CV R2 score: 0.535807284324275
Tuned Random Forest R2: 0.579687260084845

This is a noticeable, if not substantial, and certainly impactful improvement from .5588!

So let's tune XGForest in a similar way, and re-run...


After tuning XGForest and re-running, this is what we got. A substantial improvement.

Best parameters found: {'learning_rate': 0.1, 'max_depth': 7, 'n_estimators': 250, 'subsample': 0.8}
Best CV R2 score: 0.5891076022240813
Tuned XGBoost R2: 0.6212745179228656

Conclusion: In a head-to-head test with no tuning, Random Forest beat XGBoost. But in a head-to-head test with proper tuning, XGBoost was a clear winner with .04 advantage.

.04, by the way is roughly 7% improvement in predictive accuracy.

To rehash our Statistics understanding, R-squared is the co-efficient of determination.  It is a statistical metric used to evaluate how well a regression model explains the variability of the target variable. 

A 1.0 R-squared means the model predicts perfectly. A value of 0.0, would mean that the model does no better than just predicting the mean of all values.


AI / ML - Fetching Data, Quality Control, Optimization and Review

Most of my time lately has been "refining" the model. 

For example, one of the things you need to really think about doing AI is where your data is coming from, and the quality of that data - and the price of that data. 

Originally, I was using FMP for data. But the unpaid version only gives you access to 100 symbols. You cannot get far with 100 symbols, even if you collect scores of metrics and ratios on them. So when you build your initial model on FMP, say using the TTM API on 100 symbols, you will need to consider an ante-up for more symbols, or look for symbols and data elsewhere.

I have considered writing an intelligent bot to "scour" the universe of financial sites to pull in data on symbols. There are a lot more of these where you can get current data (i.e. stock price), but when it comes to statements, you are going to need to hit the SEC itself, or an intermediary or broker. If you hit these sites without reading their disclosures, you can get banned. 

At a minimum, there is the rate limit. It is critical to understand how to rate limit your fetches. So using a scheduler, and running in batches (if they're supported) can really help you.  Another thing is intelligent caching. It makes no sense to get into hot water fetching the same statement for the same symbol you just fetched an hour ago. Once you have a complete statement, you probably want to keep it in your pocket, and only update on a lower frequency if you decide to update old data at all.

So most of my time lately has been spot checking the data, building some caching and trying to do some general improvement on the processing and flow.

I found a couple of nice python tools one can use to load csv files: tabview, and vizidata. The latter is a bit more robust. Having a csv viewer is a game changer if you want to stay in a terminal and not "point and click".

With a tool like this, you can really start to backtrack into missing holes of data. I had one metric for example that was a typo (single letter) and had NO data for that metric. I had other issues with division by zero errors, Panda Dataframe vs Series issues, etc. 

You also have to pay attention to these python algorithms, and what they spit out. The stuff may look like intimidating jibberish, but it's there for a reason and taking the time to really examine it can pay off quite a bit. For example, I decided to exclude certain metrics because they had circular influence. And when you make a change like that, the feature influences can change drastically. 


Friday, May 23, 2025

AI / ML - Random Forest, Data Wrestling and Z-Scores

I was running my AI scoring algorithm, which takes as inputs a bunch of calculated metrics and ratios (features - X axis), and feeds those into a Decision Tree algorithm (Random Forest), against a price prediction (Y axis), which then prints out a report that shows how well the algorithm performed in general (R-squared), and a list of features sorted by their influence on the Y variable (price). 

There are numerous algorithms that can do this - the simplest being a Linear Regression model.  Decision Trees offer a faster and more efficient - and perhaps more accurate - alternative to linear regression, provided that the tree is pruned and managed correctly and that the tree doesn't get lopsided or imbalanced.

But I ran into problems, especially when checking the results and data carefully. And most of the issues, were related to the data itself.

Data Alignment
I noticed that the predictive z-scores for my features didn't "line up" when I printed them twice. Turns out, this was a data alignment issue. When you are using dataframes, and making copies of these dataframes and merging them, you need to be very very careful or a column can get shifted.

This alignment issue was affecting my model because the metric that WAS a profitability metric, was now being assigned to a solvency metric. Now that I have this fixed, things look much more sensible. But making sure your dataframes are aligned, is a hard-learned lesson.

Outliers
Other issues I ran into today had to do with the fact that when I printed a report out (a weighted scoring report), certain values were far and away better than others. I didn't understand this, and discussed it with the AI I am using as a consultant, who suggested I print out z-scores.

Well, if we look below, we have an evToEBITDA metric of 10.392 (insane value) on 2023 Paramount reporting data.

=== Z-scores for PARA on 2023-12-31 ===
Z-scores for PARA on 2023-12-31 in pillar 'Profitability':
  grossProfitMargin: -0.263
  operatingProfitMargin: 0.038
  netProfitMargin: 0.029
  returnOnAssets: -0.033
  returnOnEquity: -0.006
  returnOnCapitalEmployed: -0.089
  returnOnTangibleAssets: 0.004
  earningsYield: 0.008
  freeCashFlowYield: 0.000
  nopat_to_totalAssets: -0.170
  operatingReturnOnAssets: -0.215
  returnOnInvestedCapital: -0.031
  ebitda_to_totalAssets: -0.384
  operatingCashFlowToSales: 0.036
  evToSales: -0.044
  evToOperatingCashFlow: 0.054
  evToEBITDA: 10.392
  evToFreeCashFlow: 0.039
 
I audited the metrics and statements, and indeed this is correct - based on what Yahoo was returning to me on the income statement for that year (Normalized EBITDA). The unnormalized EBITDA was better, but in most cases, analysts use the Normalized value. You can't do one-offs in your code for things like this, so what do you do?

I couldn't drop the row, because I was already dropping so many 2020 rows of bad data (due to Covid I suspect). I drop rows that are missing >35% of metrics. When you get a row that has all of the values you need, you tend to want to use it. I don't have code that drops rows that don't have specific dealbreaker metrics - maybe I should, but there are so many metrics that generally I figure I can score and rank even if I am missing one here or there, even a fairly well-known or important one. 

So - what do you do?

Winsorization. In other words, capping. It might make sense to invest the effort in Winsorizing all of the metrics and ratios. But for now, I am only doing it on these EBITDA ones.

Monday, May 19, 2025

AI / ML - It's All About the Data. Imputation and Clustering Algorithms

In spare time, I have been working on a Fintech project, which is done in conjunction with a thick book I have been reading called Machine Learning for Algorithmic Trading by Stefan Jansen.

I am mostly finished with this book, and have coded - from scratch - my own implementations of the concepts introduced in this book. 

What have I learned thus far?

It is ALL ABOUT THE DATA. Most of my time has been scrutinizing the data. Disqualifying data, throwing away of imputing data that has no values, and Winsorizing/capping data values so that they don't skew into outliers.

Dates. Dates have always been a problem. Dropping timestamps off of dates properly so that date comparisons and date math work properly.

So far, a lot of what I have done is data clustering, using algorithms like DBSCAN, K-Means, Agglomerative, etc to find useful cluster patterns. Regression techniques to find correlations. The models and scoring so far are my own "secret sauce" Deterministic models. But I do plan to snap in some AI to do automatic weight adjustment soon. 

Right now, I am using my own Deterministic scoring model - so it can be used as a comparative baseline. But eventually I will enhance this to be more dynamic through self-learning.  

Friday, April 4, 2025

SLAs using Zabbix in a VMware Environment

 Zabbix 7 introduced some better support for SLAs. It also had better support for VMware.

VMware, of course now owned by Broadcom, has prioritized their Aria Operations (VROPS) monitoring suite over any of the alternative monitoring solutions (of which there is no shortage). Usually open source solutions have a limited life cycle as developers leave the project and move on to the next zen thing. Zabbix is still widely popular after many years. They got it mostly right the first time, and it absolutely excels at monitoring Linux. 

To monitor VMware, it relies on VMware templates - and it used to present "objects" like datastores, as hosts. In version 7, it no longer does this, and instead tie the datastores as attributes of the true hosts - hypervisors, virtual machines, etc. This makes it a bit harder to monitor a datastore in an of itself - getting free space, used space, etc. if you want to do that.  But - in version 7 there are now all kinds of hardware sensors and stuff that were not available in version 5. There are more metrics (items), more triggers that fire out of the box, etc.

One big adjustment in v7 is the support for SLAs. I decided to give it a shot.

The documentation only deals with a 3 node cluster. Such as a back-end cluster. That is not what I wanted.

What I wanted, was to monitor a cluster of hypervisors in each of multiple datacenters.

To do this, I started with SLAs:

  • Rollup SLA - Quarterly
  • Rollup SLA - Weekly
  • Rollup SLA - Daily

 Then I created a Service

  • Rollup - Compute Platform

Underneath this, I created a Service for each data center. I used two tags on each one of these, one for datacenter and the other for platform (to future-proof in the even we use multiple platforms in a datacenter). Using an example of two datacenters, it looked like this.

  • Datacenter Alpha Compute
    • datacenter=alpha
    • platform=accelerated
  • Datacenter Beta Compute
    • datacenter=beta
    • platform=accelerated 

These services have really nothing defined in them except the tags, and I assigned a weight of 1 to each of them (equal weight - we assume all datacenters are equally important).

Underneath these datacenter services, we defined some sub-services.

  • Datacenter Alpha Compute
    • Health
      • Yellow
      • Red
    • Memory Usage
    • CPU
      • CPU Utilization
      • CPU Usage
      • CPU Ready
    • Datastore
      • Read Latency
      • Write Latency
      • Multipath Links
    • Restart 

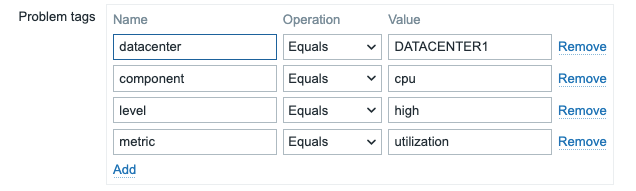
We went into the trigger prototypes, and made sure that the datacenter, cluster and platform were set as tags so that all problems would have these tags coming in, necessary for the Problem Tag filter.  We also had to add some additional tags to differentiate between severity warning and critical (we used level=warning for warnings, and level=high for anything higher than a warning). 

On the problem tags filter, we wanted to catch only problems for our datacenters and this specific platform, so we used those two filters on every tag. In this example below, we have a cpu utilization service - a sub-service of CPU, which in turn is a sub-service of a datacenter.

This worked fairly well, until we started doing some creative things.

First, we found that all of the warnings were impacting the SLAs. What we were attempting to do, was to put in some creative rules, such as:

  • If 3 hypervisors or more in a cluster have a health = yellow, dock the SLA
  • Use a weight of 9 on a health red, and a weight 3 on as situation where 3 hypervisors in a cluster have a health of yellow. 

THIS DID NOT WORK. Why? Because unless every single hypervisor was a sub-service, there was no way to make it work because the rules all applied to child services. We couldn't have all of the hypervisors be a sub-service - too difficult to maintain, too many of them, and we were using Discovery which meant that they could appear or disappear at any time. We needed to do SLAs at the cluster level or the datacenter level, not individual servers (even though indeed we monitor individual servers, but they are defined through discovery).

So, we had to remove all warnings from the SLAs

    • They were affecting the SLA too drastically (many hypervisors hit health=yellow for a while and then recover). We had to revert to just the red ones and assume that a health=red affects availability (it doesn't truly affect availability necessarily, but it does in certain cases).

    • We could not make the rules work without adding every single hypervisor in every single datacenter as a sub-service which simply wasn't feasible.

The problem we now face, is that the way the SLAs roll up, the rollup SLA value is essentially the lowest of the SLA values underneath it.

  • Platform SLA (weight 0) = 79.7 - huh?
    • Datacenter A (weight 1) = 79.7
    • Datacenter B (weight 1) = 99.2
    • Datacenter C (weight 1) = 100

The platform SLA should be an average, I think, of the 3 datacenters if they are all equal-weighted. But that is not what we are observing.

The good news though, is that if Datacenter A has a problem with health=red, the length of time that problem exists seems to be counting against the SLA properly. And this is a good thing and a decent tactic for examining an SLA.

The next thing we plan to implement, is a separation between two types of SLAs:

  • Availability (maybe we rename this health)
  • Performance
So a degradation in cpu ready, for example, would impact the performance SLA, but not the availability SLA. Similar for read/write latency on a datastore. 

I think in a clustered hypervisor environment, it is much more about performance than availability. The availability might consider the network, the ability to access storage, and whether the hypervisor is up or down. The problem is that we are monitoring individual hypervisors, and not the VMware clusters themselves, which are no longer presented as distinct monitor-able objects in Zabbix 7.
 
But I think for next steps, we will concentrate more on resource usage, congestion, and performance than availability.

Optimizing for NUMA in a Virtualized Environment

Back in January, we had a platform tenant come to us requesting that the vcpu.numa.preferHT setting be set on all of their VMs. As we weren't completely familiarized with this setting, it naturally concerned us since this is a shared on-prem cloud platform that runs VNFs.  This particular tenant had some extremely latency-sensitive workloads, so they were interested in reducing latency and jitter that one of their customers had apparently complained about.

Diving into NUMA in a virtualized environment is not for lightweights. It requires you to understand SMP, the latest advances in NUMA architecture, and on top of that, how it maps and applies to VMs that run operating systems like Linux, on top of what is already a POSIX Unix-like or Linux-like OS (PhotonOS) which is proprietary.

I found that this diagram has been extremely helpful in showing how NUMA works to platform tenants who don't understand NUMA or don't understand it well.


In this diagram, we have a theoretical dual socket cpu system, which has 24 cores on each socket. So 48 total physical cores. Each socket is a physical NUMA node, so there is a Numa Node 0, and a Numa Node 1. Now this is not a "law" that a socket is equivalent to a physical numa node, but in this scenario, that is indeed the case (and on many low to mid-grade servers, depending on the chipset and architecture you will usually see sockets being equal to numa nodes).

Each NUMA node usually gets its own "memory real estate". To use a kitchen analogy, the idea is that processes (VMs) that access memory should be able to hit their local cache (i.e. kitchen table), but if they get a cache-miss, they can pull from their local memory allotment (i.e. run to the basement pantry). If this is not possible, there is an expensive "trip to the store" - remote memory - which takes longer to retrieve from. So you want, ideally, 100% of the memory requests to be local in a high performing environment.

If one were to go into the BIOS and enable Hyperthreading, contrary to what people seem to think, this does NOT double the number of processor cores you have! What happens, on each socket, is that the physical cores are halved, presenting 48 "logical" cores instead of 24 physical cores.

Now, hyperthreading does give some advantages - especially for certain kinds and types of workloads. There is a high (and always growing) amount of non-blocking parallelism in SMT processing, so having 48 cores can certainly boost performance - although this is an in-depth topic that is not covered in great depth in this post.  But the important takeaway is that by increasing from 24 cores to 48 logical cores, it is not a pure linear increase. There is considerably more overhead managing 48 cores than 24 just for starters. Then there is the context-switching and everything else that factors in.

A virtual machine (that is NOT numa aware), that is provisioned for 52 vCPU, does NOT fit onto a single NUMA node (which has 24 cores, but 48 if HT is enabled). It may be provisioned by default to have 1 core per socket resulting in 52 sockets which allows the hypervisor to "sprinkle them around" to available slots of all of the NUMA nodes at the expense if managing this. Or, perhaps the provisioned steps in and overrides default behavior and specifies 52 cores on a single socket. Neither situation will contain a VM onto a single NUMA node because of the simple fact that it does not fit. There are only 24 physical cores - and 48 if Hyperthreading is enabled as it is in this particular example.  

Now to elaborate on this example, there really aren't even 24 physical cores because the OS of the hypervisor is going to reserve cores for itself - perhaps two physical cores on each socket. So in reality, one may think they can fit a 48 core VM (people like to provision in a power of 2 in a binary world) onto a single NUMA node (in this example), only to discover that this isn't the case after deployment, because they in fact needed to provison with 44 cores in order for the numa placement algorithm to "home" the VM on one NUMA home node (0) versus another adjacent one (1).

So "rightsizing" a VM, using 44 cores on a single socket will give some performance benefit in most cases, because the VM will be scheduled on one NUMA node or another in this example. If you provisioned 2 VMs, one might NUMA node 0 while the next one gets assigned NUMA node 1. But, they should stay put on that home node. UNLESS - more VMs are provisioned, and contention begins. In this case, the NUMA scheduler may decide to shift them from one NUMA node to another. When this happens, it is known as a "NUMA Migration".

As stated earlier, when a VM is on a specific NUMA node, it is best to have its memory localized. But it IS possible to provision a 44 core VM that sits on a NUMA Home Node (i.e. 0), but the memory is 90% localized instead of fully localized. In this case, the VM might have more memory provisioned than it should, to be properly optimized.  This is why it is super important to ensure that the memory is being utilized - and not just reserved! And frankly, the same with the vCPU resources! But in general, making a VM "NUMA Aware" by having it sized to fit on NUMA nodes will cut down on migrations, and in most cases (but not all), improve performance.

VMware has a "Rightsizing" report in Aria Operations, that figures this out - and exposes VMs that were over-provisioned with memory and cores that are not being used.  This is a big problem for a shared environment because the net effect of having scores of VMs on a hypervisor that are underutilized, is that the CPU Ready percentage starts to go through the roof. You will look at the stats, and see low CPU utilization and low memory utilization, and think "everything looks under control". But then you will look at the latency on datastores (read and write - write especially), or the CPU Ready percentage (which is showing how much time a process waits for CPU runtime - or, time on the die), and see that they are unsatisfactory to downright abysmal. This is why the Rightsizing report exists - because instead of buying more hardware, there does exist the option to downsize (rightsize) the virtual machines without making additional capital investments in hardware servers.

Last topic to discuss, is NUMA Node Affinity. VMs can set, in Advanced Properties, a NUMA Node Affinity. This is a very very dangerous setting, because now, with this set, a VM literally stays put, and it could be at the expense of everything else in a shared infrastructure because the NUMA load balancer can't touch it or move it. 

As I understand it, the vCPU "Hot Add" feature also nullifies what the NUMA load balancer is trying to do, because of the fact that elasticity of vCPUs creates an "all bets are off" situation that it simply can't manage effectively. In this day and age of automation and auto-scaling, all of these auto scaling engines that want to monitor CPU and add it "hot" (on the fly - without shutting a VM down and restarting it) look super cool. But they can result in severe performance degradation.

Lastly, the vcpu.numa.preferHT setting - what this does, is align a virtual machine (vCPU topology) with the underlying physical topology. This gets into the topic of VPD (Virtual Proximity Domain) and PPD (Physical Proximity Domain). By using preferHT, the NUMA scheduler will take more aggressive advantage of hyperthreads when making core placements, than it would using physical cores as the basis for its placements (which prioritizes memory locality). 

If a VM is cache / memory intensive, memory locality is important. Say you are running a VM with a Times Ten in-memory database.  But if you are a packet-pumping cpu-intensive VM that doesn't need to do a lot of memory access (reads and writes), the computational boost of hyperthreading might give these VMs more of an advantage.

Removing Two Stale Macro Features

  Removing Two Stale Macro Features The model was trained on 11 features, two of which were macroeconomic sentiment indicators sourced from...